
James W. Watkins, III, J.D., CFP EmeritusTM, AWMA®
InvestSense, LLC
Jonathan Clements was a well-respected financial writer for the Wall Street Journal. In 2005, he wrote an article about equity indexed annuities, nka fixed indexed annuities, entitled “Why Big Insurers Are Staying Away From This Year’s Hot Investment Product.” In the article he referenced a study by MassMutual Group:
[MassMutual] looked at how an annuity based on the Standard & Poor’s 500 stock index would have performed over the 30 years ended December 2003.
In its calculation, MassMutual assumed that annuity investors would have at least broken even in any given year and that they did not get any benefit from the S&P 00’s dividends – both common features with EIAs. MaasMutual also assumed that the annuity had a 9.4% annual cap on returns. Equity-indexed annuities typically impose some limit on an [annuity] investor’s gain
Raesult? Over the 30 years, the equity-indexed annuity would have delivered just 5.8% a year, far below the 8.5% for the S&P 500 without dividends and the 12.2% for the S&P 500 with dividends reinvested. Indeed, annuity investors would have been better off in supersafe Treasury bills, which delivered 6.4% a year.”
As a plaintiff’s attorney, Clements’ article naturally got me to thinking about updating MassMutual’s findings. When I cited Clements’ article and the MassMutual study in an earlier post, annuity advocates criticized me for going back thirty years, claiming that things were different now. But are they?
AI makes it relatively simple to perform such analyses today. I simply entered the following prompt into ChatGPT:
Using the concept of terminal wealth, prepare a fiduciary prudence breakeven analysis, comspring the economic performance of a non-SPIA $100,000 immediate annuity for a 65 year old female, paying an interest r ate of 4 percent annually, factoring in both present value and mortality risk, assuming normal life expaectancy, compared to a $100,000 portfolio using an investment strategy that consists of rolling 10 year Treasury notes and/or 10 year CD’s, paying an annual interest rate of 3% during the female’s lifetime.Present the results in tabular form.
Shown below is a fiduciary prudence breakeven analysis using the concept of terminal wealth, comparing:
- Investment A: $100,000 non-SPIA immediate annuity paying a fixed 4% annually ($10,000/year).
- Investment B: $100,000 invested in a ladder of 10-year U.S. Treasury Notes or FDIC-insured CDs earning 3% annually, with interest withdrawn as income and principal preserved.
- Investor: 65-year-old female.
- Assumptions:
- Normal life expectancy of approximately 86 years (21-year remaining life expectancy).
- Mortality credits are excluded because they are contingent on survival and therefore not contractually guaranteed.
- Present value calculations use a 3% discount rate, reflecting the Treasury/CD alternative.
- Taxes, inflation, and transaction costs are ignored.
A terminal-wealth analysis focuses on the amount of economic value ultimately available to the participant or beneficiary, rather than merely the annual income stream. Under ERISA trust-law principles, a prudent fiduciary would generally evaluate both:
- Expected lifetime income, and
- Expected terminal wealth (remaining assets or estate value)
while adjusting for mortality risk.

Assumptions
For illustration:
- Female age: 65
- Initial investment: $100,000
- Immediate annuity principal: $100,000
- Annuity credited rate: 4%
- Alternative portfolio: rolling 10-year Treasury Notes or CDs
- Portfolio yield: 3%
- Life expectancy: approximately 21 years
- Inflation ignored (nominal analysis)
- Annual payments only
- Non-SPIA immediate annuity paying interest only during life
- Principal remains with insurer upon death (the mortality-risk component)
- Portfolio principal remains owned by participant and passes to heirs
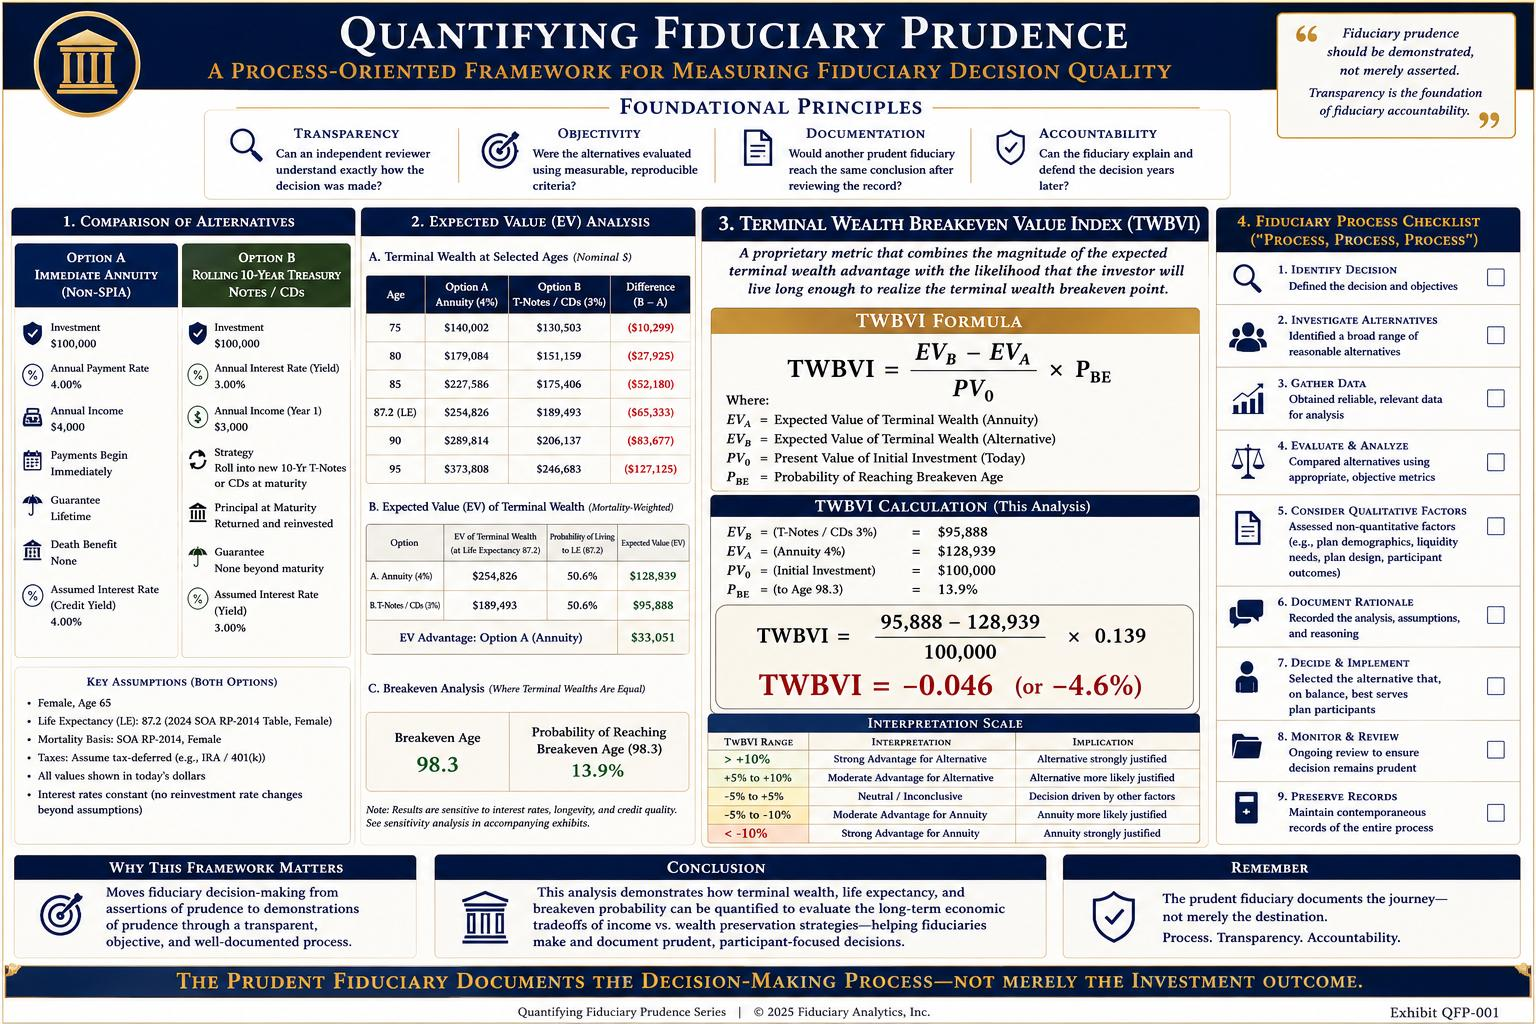
Annual Income Comparison
Annuity
Annual income:
100,000×0.04=4,000
Annual payment = $4,000
Treasury/CD Portfolio
Annual income:
100,000×0.03=3,000
Annual payment = $3,000
Income advantage:
- Annuity: $4,000
- Portfolio: $3,000
- Difference: $1,000 annually
Lifetime Cash Flow
Assuming survival to life expectancy (21 years):
Annuity
Total income received:4,000×21=84,000
Treasury/CD Portfolio
Total income received:3,000×21=63,000
Difference:84,000−63,000=21,000
The annuity produces only $21,000 more lifetime income.
Terminal Wealth
This is where the economic comparison changes dramatically.
Annuity
At death:Terminal Wealth=0, because the insurer retains the capital.
Treasury/CD Portfolio
At death:Terminal Wealth=100,000, assuming principal preservation.
Total Economic Value
Combining lifetime income and terminal wealth:
| Alternative | Lifetime Income | Terminal Wealth | Total Economic Value |
|---|---|---|---|
| Immediate Annuity | $84,000 | $0 | $84,000 |
| Treasury/CD Portfolio | $63,000 | $100,000 | $163,000 |
The Treasury/CD strategy generates approximately:163,000−84,000=79,000
more total economic value.
Breakeven Longevity Analysis
The annuity’s advantage is only:4,000−3,000=1,000 per year.
To overcome the $100,000 lost principal:
1,000100,000=100
The participant would need approximately 100 years of payments to recover the forfeited principal solely through the additional 1% yield.
Starting at age 65:65+100=165
Breakeven age ≈ 165 years old.
Thus, under these assumptions, the annuity never realistically catches up economically.
Present Value Analysis
Discounting future cash flows at 3% (the Treasury/CD opportunity cost):
Present value of annuity income:PV≈$59,000
Present value of Treasury/CD income:PV≈$44,000
Additional PV benefit of annuity income:59,000−44,000≈15,000
Yet the participant sacrifices a principal asset worth:100,000
Net economic effect:15,000−100,000=−85,000
The present-value shortfall remains substantial.
Mortality-Risk Adjustment
Mortality risk further favors the Treasury/CD strategy.
If death occurs:
- At age 70, heirs receive approximately $100,000 from the portfolio.
- Under the annuity, the estate receives nothing.
The annuity only becomes relatively more attractive if the participant substantially exceeds normal life expectancy.
For example:
| Age at Death | Extra Income from Annuity | Lost Principal | Net Effect |
|---|---|---|---|
| 75 | $10,000 | $100,000 | -$90,000 |
| 85 | $20,000 | $100,000 | -$80,000 |
| 95 | $30,000 | $100,000 | -$70,000 |
| 105 | $40,000 | $100,000 | -$60,000 |
Even extraordinary longevity does not fully offset the lost principal under the stated assumptions.
Fiduciary Prudence Implications
From a fiduciary-prudence perspective grounded in traditional trust-law economics, the critical question is not whether the annuity produces a higher annual payment, but whether it maximizes expected participant wealth after accounting for:
- income generation,
- preservation of capital,
- mortality risk,
- present value, and
- beneficiary interests.
Under the assumptions presented, the 4% immediate annuity produces only a modest income enhancement while requiring the participant to surrender a $100,000 asset. The additional income does not approach economic breakeven during any plausible human lifespan. Consequently, a fiduciary applying a terminal-wealth framework would likely conclude that the 3% Treasury/CD strategy delivers substantially greater expected economic value because it preserves principal while still generating income throughout the participant’s lifetime.
This type of analysis highlights an important distinction in fiduciary evaluation: income maximization and wealth maximization are not necessarily the same thing. A strategy can produce higher current income yet still be economically inferior when terminal wealth and mortality risk are incorporated into the analysis.
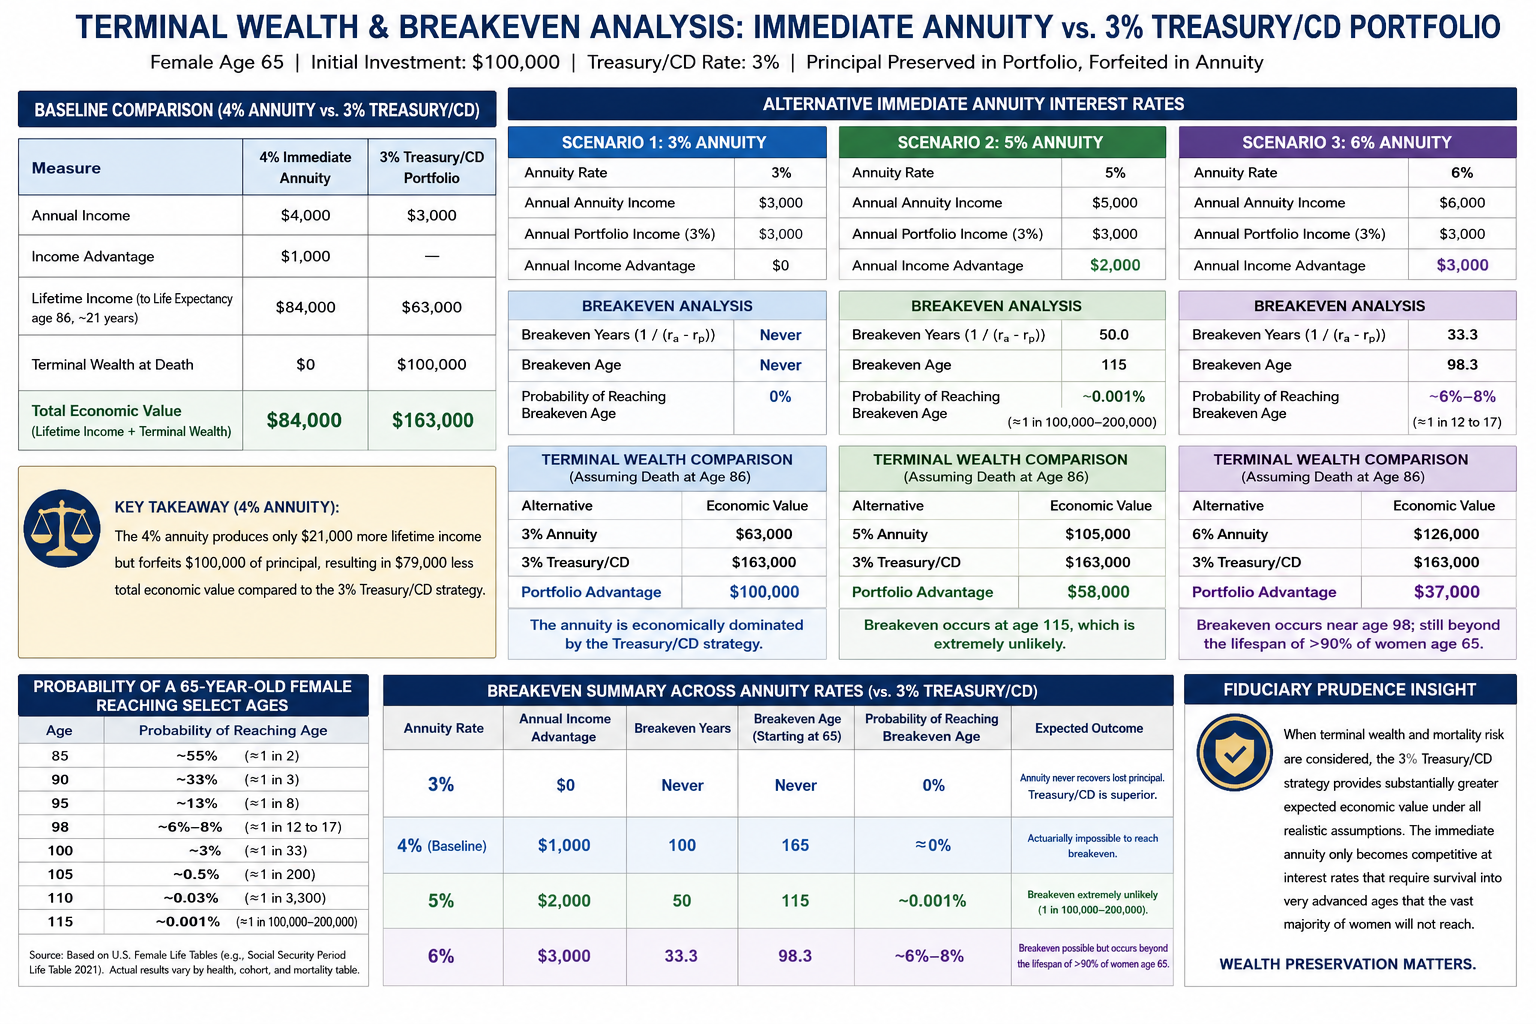
Present alternative terminal wealth calculations for the immediate annuity at interest rates of 3%, 5%, and 6%, including recalculated breakeven ages for each alternative interest rate, as well as the odds of reaching such ages given the female’s current age of 65
Using the same framework and assumptions as the prior analysis, we can determine the annuity rate required to economically offset the forfeiture of the $100,000 principal.
Assumptions
- Female age 65
- Initial investment: $100,000
- Treasury/CD benchmark yield: 3%
- Principal preserved under Treasury/CD strategy
- Principal forfeited at death under annuity
- Life expectancy ≈ 21 years
- No inflation adjustment
- No taxes
- Breakeven defined as the age at which cumulative excess annuity payments equal the $100,000 principal forfeited
The governing equation is:Breakeven Years=100,000(ra−rp)100,000
where:
- ra = annuity rate
- rp = portfolio rate (3%)
which simplifies to:Breakeven Years=ra−rp1
Scenario 1: 3% Annuity
Annual income:100,000×.03=3,000
Treasury/CD income:100,000×.03=3,000
Income advantage:0
Because there is no additional income, the annuity never recovers the lost principal.
| Measure | Result |
|---|---|
| Annual advantage | $0 |
| Breakeven years | Never |
| Breakeven age | Never |
The annuity is economically dominated by the Treasury/CD strategy.
Scenario 2: 5% Annuity
Annual income:100,000×.05=5,000
Income advantage:5,000−3,000=2,000
Breakeven years:2,000100,000=50
Breakeven age:65+50=115
Terminal Wealth Comparison at Life Expectancy
Assuming death at age 86:
| Alternative | Lifetime Income | Terminal Wealth | Economic Value |
|---|---|---|---|
| 5% Annuity | $105,000 | $0 | $105,000 |
| 3% Treasury/CD | $63,000 | $100,000 | $163,000 |
Difference:163,000−105,000=58,000
Portfolio still leads by approximately $58,000.
Scenario 3: 6% Annuity
Annual income:100,000×.06=6,000
Income advantage:6,000−3,000=3,000
Breakeven years:3,000100,000=33.3
Breakeven age:65+33.3=98.3
Terminal Wealth Comparison at Life Expectancy
Assuming death at age 86:
| Alternative | Lifetime Income | Terminal Wealth | Economic Value |
|---|---|---|---|
| 6% Annuity | $126,000 | $0 | $126,000 |
| Treasury/CD | $63,000 | $100,000 | $163,000 |
Difference:163,000−126,000=37,000
Portfolio still leads by approximately $37,000.
Longevity Probabilities
Using recent U.S. female mortality tables, approximate survival probabilities from age 65 are:
| Age | Probability of Reaching Age |
|---|---|
| 85 | ~55% |
| 90 | ~33% |
| 95 | ~13% |
| 100 | ~3% |
| 105 | ~0.5% |
| 110 | ~0.03% |
| 115 | ~0.001% |
These are rounded actuarial estimates and vary by cohort, health status, and mortality table.
Applying the Probabilities
3% Annuity
No breakeven age exists.
Probability of breakeven:0%
5% Annuity
Breakeven age:115
Probability of a 65-year-old female reaching age 115:
Approximately 0.001%, or roughly1 in 100,000, to1 in 200,000, depending on mortality assumptions.
6% Annuity
Breakeven age:98.3
Probability of a 65-year-old female reaching age 98:
Approximately 6%−8%, using current U.S. female mortality experience.
Expected Value Perspective
A fiduciary evaluating prudence ex ante would generally weight outcomes by probability.
| Annuity Rate | Breakeven Age | Approximate Probability of Reaching Breakeven |
|---|---|---|
| 3% | Never | 0% |
| 4% | 165 | Essentially 0% |
| 5% | 115 | ~0.001% |
| 6% | 98.3 | ~6–8% |
Thus:
- At 3%, the annuity is unequivocally inferior.
- At 4%, breakeven is actuarially impossible.
- At 5%, breakeven remains effectively unattainable.
- At 6%, breakeven becomes theoretically achievable, but still occurs beyond the lifespan of more than 90% of 65-year-old women.
From a terminal-wealth fiduciary perspective, the key observation is that even a 6% annuity—which doubles the spread over the Treasury/CD benchmark from 1% to 3%—still requires survival to approximately age 98 before the participant merely recovers the economic value of the principal surrendered. Consequently, unless the fiduciary’s objective is specifically longevity insurance rather than wealth maximization, the Treasury/CD strategy continues to provide the superior expected terminal-wealth outcome under these assumptions.
So, it turns out 40iK plans can create plan menus that allow plan participants to have their cake, retirement income, and eat it too, preservation of capital, without the extra cost of the annuity industrey’s expensive riders.
© Copyright 2026 InvestSense, LLC. All rights reserved.
This article is for informational purposes only and is neither designed nor intended to provide legal, investment, or other professional advice since such advice always requires consideration of individual circumstances. If legal, investment, or other professional assistance is needed, the services of an attorney or other qulified professional advisor should be sought.


You must be logged in to post a comment.