James W. Watkins, III, J.D., CFP EmeritusTM, AWMA®
InvestSense, LLC
May It Please the Court:
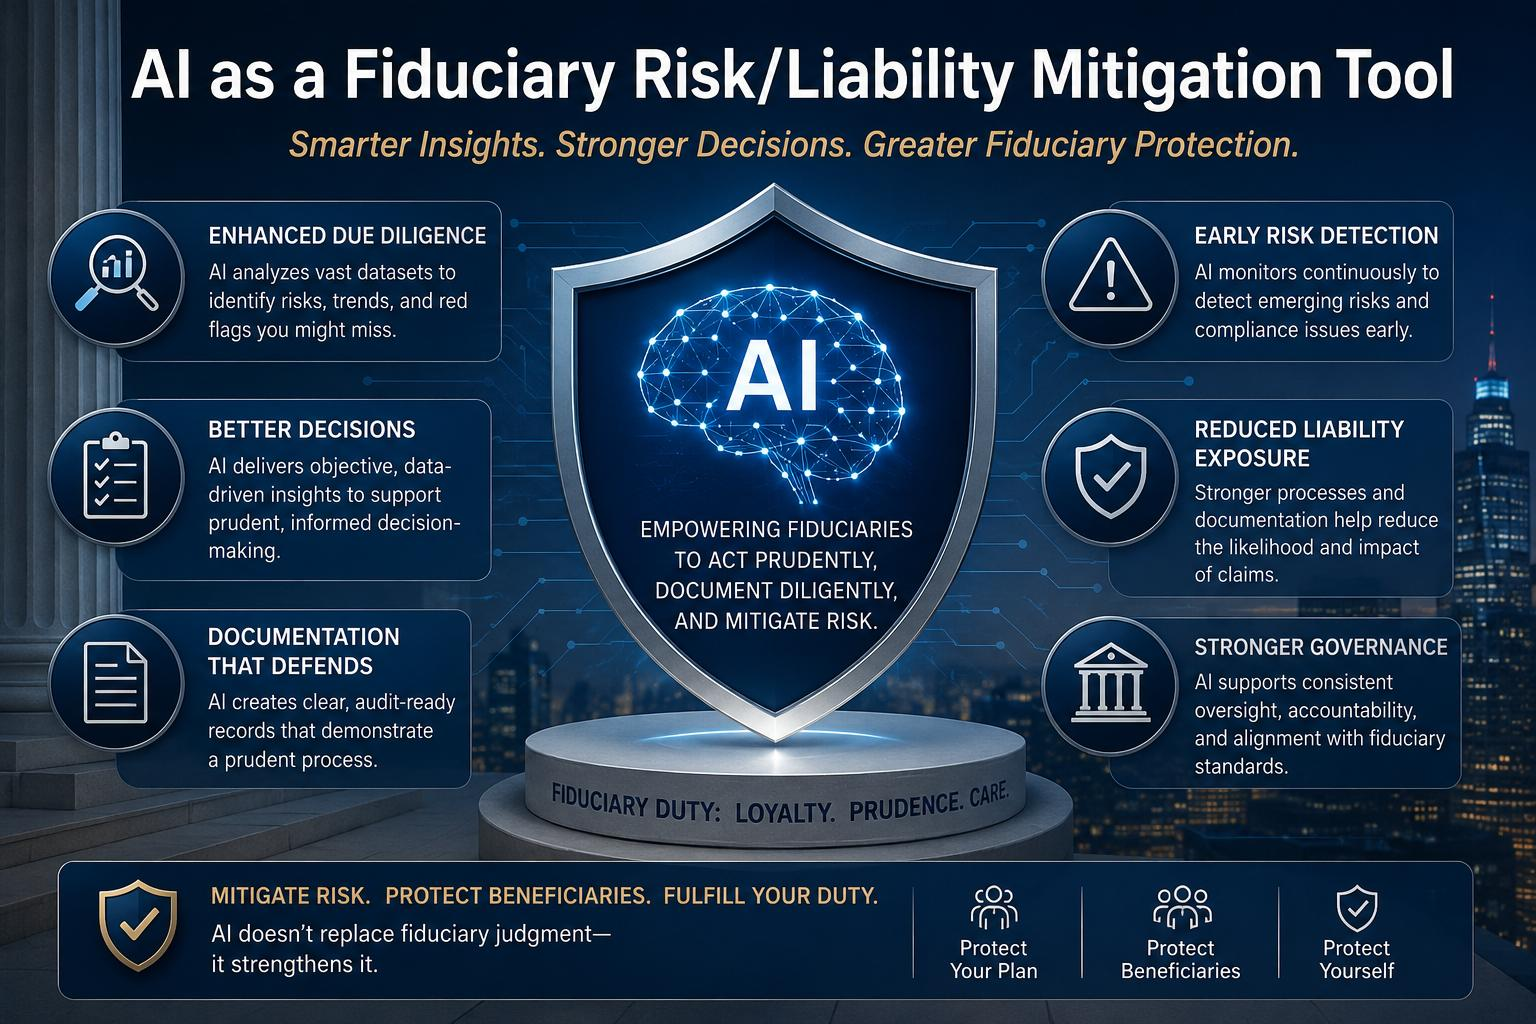
The question before this Court is not whether artificial intelligence should replace fiduciary judgment. It should not. The question is whether fiduciaries acting under the prudent expert standard imposed by the Employee Retirement Income Security Act of 1974 (“ERISA”) may appropriately employ advanced analytical technologies to better satisfy their duties of prudence, loyalty, and process. The answer is not merely yes—it is that modern fiduciary obligations increasingly counsel in favor of doing so.
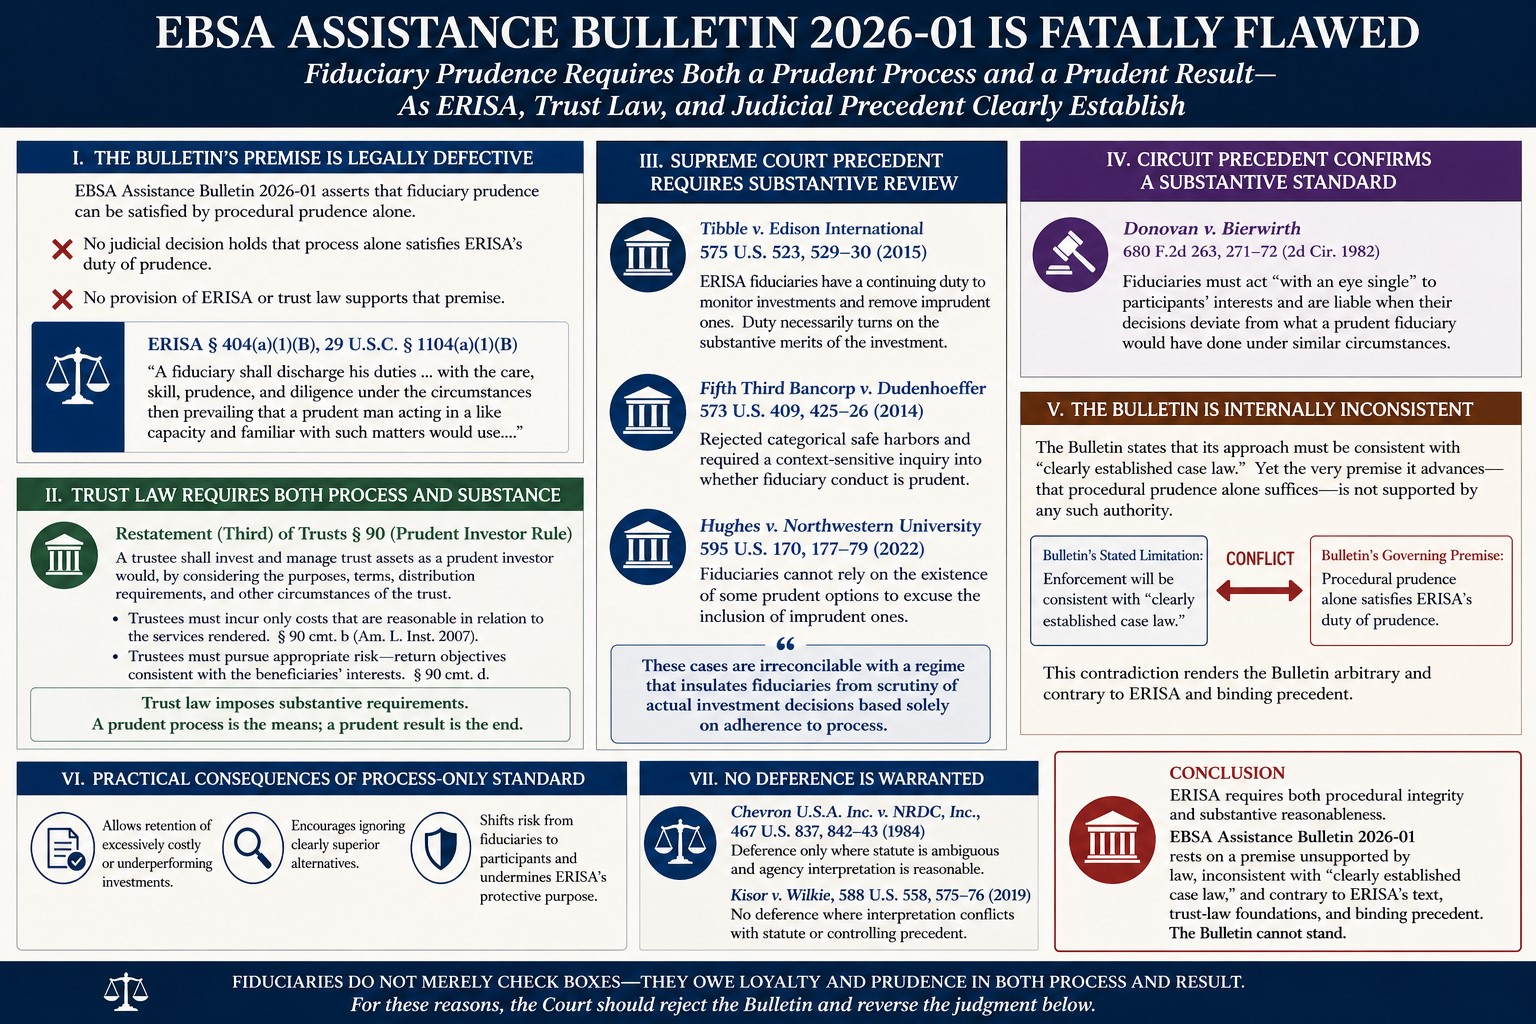
At its core, ERISA is a process statute. Courts have repeatedly emphasized that fiduciary liability ordinarily turns not on investment outcomes, but on whether fiduciaries employed a reasoned, informed, and well-documented decision-making process, resulting in substantively prudent results as well. Artificial intelligence, when used as a decision-support tool rather than a decision-maker, directly enhances every component of that process.
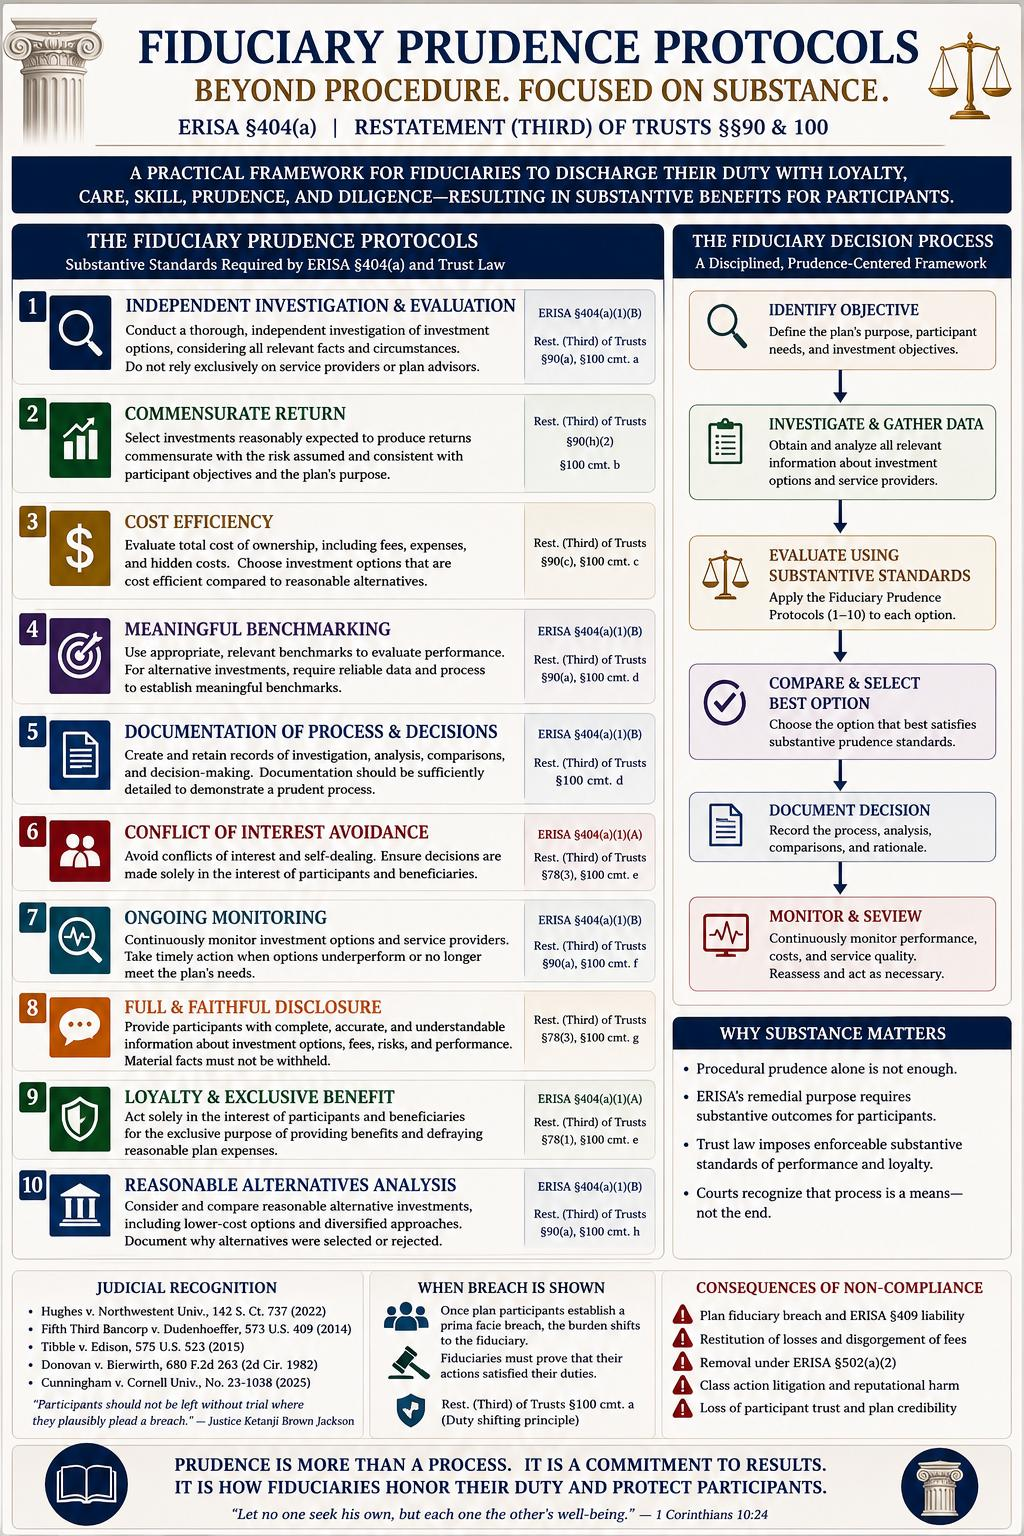
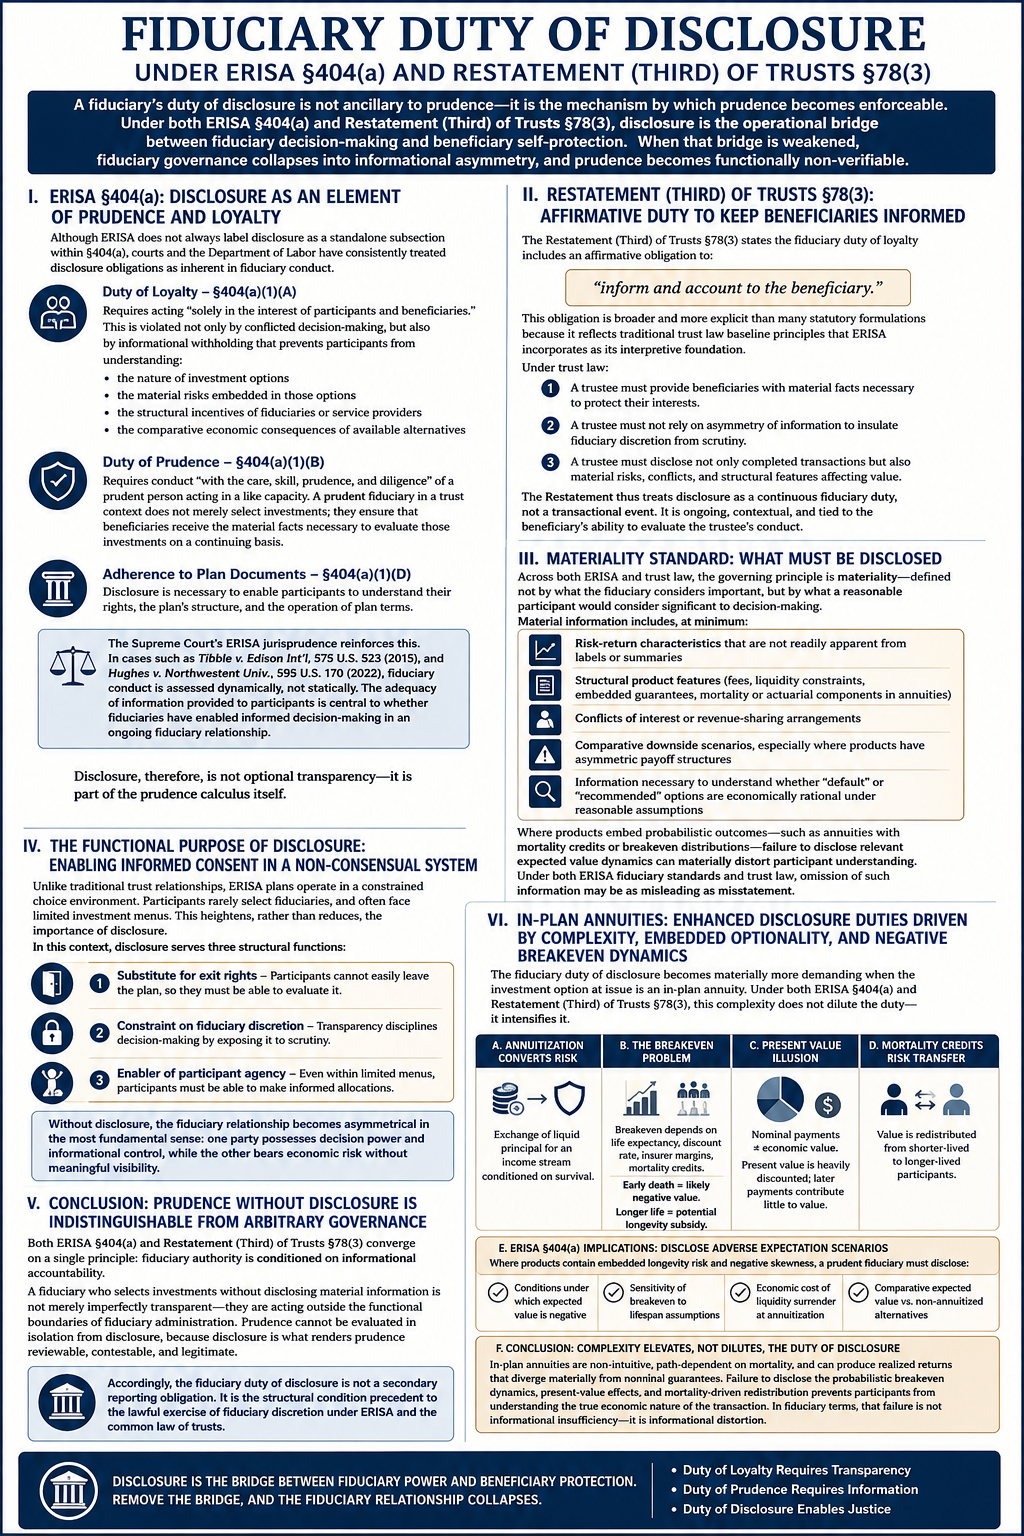
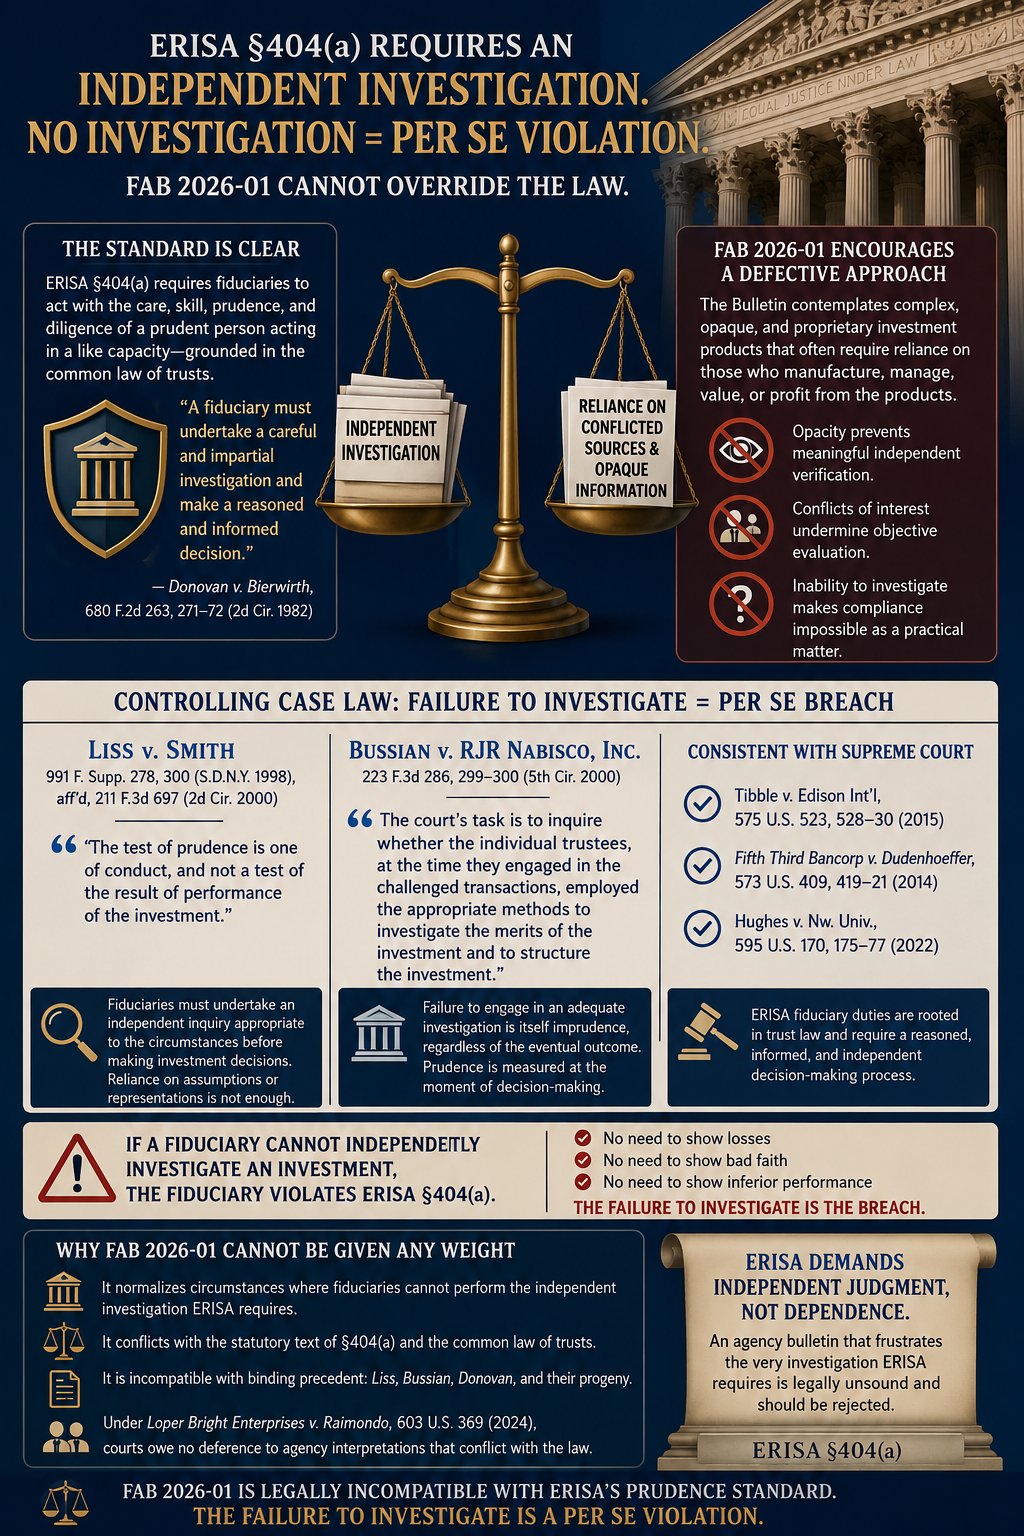
The duty of prudence requires fiduciaries to act “with the care, skill, prudence, and diligence under the circumstances then prevailing that a prudent man acting in a like capacity and familiar with such matters would use.” That statutory language is inherently dynamic. It requires fiduciaries to employ those tools that reasonably prudent experts utilize as financial analysis evolves.
Just as fiduciaries once progressed from handwritten ledgers to spreadsheets, from manual performance calculations to institutional analytics, and from paper investment committees to sophisticated portfolio management systems, today’s fiduciaries may appropriately incorporate artificial intelligence into their analytical framework. The law does not freeze prudence in time. Prudence evolves with available methods that improve decision quality while preserving independent fiduciary judgment. Artificial intelligence provides precisely that advancement opportunity
First, AI dramatically improves the quality and completeness of cost-benefit analyses required for evaluating investment alternatives, including mutual funds. A prudent fiduciary must evaluate expense ratios, revenue sharing, trading costs, turnover, tracking error, risk-adjusted performance, manager consistency, benchmark deviations, asset growth, economies of scale, and qualitative operational considerations. Historically, assembling these data required substantial manual effort, increasing the likelihood that material factors might be overlooked.
Artificial intelligence enables fiduciaries to aggregate thousands of data points across multiple databases within minutes rather than weeks. It can identify statistically significant differences among investment alternatives, model fee reductions under varying asset assumptions, quantify long-term participant savings under alternative fund structures, and generate sensitivity analyses across numerous market conditions.
More importantly, AI creates a transparent analytical record. Rather than relying upon conclusory committee minutes stating that investments were “reviewed,” fiduciaries can preserve comprehensive documentation demonstrating precisely what factors were considered, what assumptions were utilized, what alternatives were modeled, and why one investment was reasonably selected over another. That documentation substantially mitigates litigation risk because courts evaluating fiduciary conduct consistently examine process rather than hindsight.
Second, artificial intelligence materially improves the evaluation of in-plan annuity options through sophisticated breakeven analysis. The selection of lifetime income products presents one of the most analytically complex decisions confronting retirement plan fiduciaries.
Participants differ significantly with respect to:
- age,
- health,
- mortality expectations,
- marital status,
- inflation assumptions,
- discount rates,
- withdrawal behavior,
- investment return expectations,
- tax treatment,
- survivor benefits,
- liquidity preferences, and
- longevity risk.
Traditional analyses frequently reduce these variables to simplistic averages. Artificial intelligence instead permits individualized scenario modeling across thousands—or even millions—of possible outcomes.
AI can instantly calculate breakeven ages under multiple market environments, compare systematic withdrawals against guaranteed lifetime income, perform Monte Carlo simulations incorporating stochastic investment returns, model inflation-adjusted purchasing power over decades, evaluate mortality assumptions under varying demographic characteristics, and quantify the economic value of longevity insurance embedded within annuity products.
These analyses do not dictate fiduciary decisions. Rather, they illuminate the consequences of alternative decisions with greater precision than previously possible. This distinction is legally critical.
ERISA requires informed judgment—not uninformed intuition. Artificial intelligence enhances information. The fiduciary retains judgment.
Third, AI significantly strengthens fiduciary oversight throughout the life cycle of investment monitoring. Prudent monitoring is not episodic. It is continuous.
Artificial intelligence can automatically detect:
- significant fee changes,
- benchmark underperformance,
- manager style drift,
- abnormal risk exposures,
- unusual portfolio concentrations,
- operational red flags,
- regulatory developments,
- market anomalies, and
- emerging litigation involving service providers.
Instead of relying upon quarterly manual reviews, fiduciaries receive timely identification of issues requiring human attention. This improves—not replaces—fiduciary oversight.
Indeed, one of the principal criticisms raised in excessive-fee litigation is that fiduciaries failed to identify available lower-cost alternatives or failed to investigate changing circumstances. Artificial intelligence directly addresses those criticisms by systematically reviewing information that human committees might reasonably overlook because of volume, complexity, or resource limitations.
Fourth, AI substantially reduces fiduciary litigation risk through improved documentation. Experienced ERISA litigators understand that fiduciary cases frequently become battles over committee records. Years after decisions were made, plaintiffs attempt to reconstruct allegedly deficient processes from sparse meeting minutes.
Artificial intelligence can generate contemporaneous reports documenting:
- the data reviewed;
- the alternatives considered;
- the assumptions employed;
- sensitivity analyses performed;
- quantitative comparisons generated;
- qualitative factors evaluated; and
- the rationale supporting committee recommendations.
This contemporaneous documentation provides objective evidence that fiduciaries discharged their obligations through a disciplined and informed process. Such evidence directly supports judicial findings of procedural prudence.
Opponents may argue that artificial intelligence creates new risks. Certainly it does. Any analytical tool may be misused. But those risks are manageable through traditional fiduciary safeguards.
- Fiduciaries must validate the accuracy of the input data.
- They must understand model assumption..
- Fiduciaries must uhnderstand model assumptions.
- They must question questionable inputs.
- They must avoid algorithmic bias.
- They must preserve independent judgment.
None of these obligations undermine AI’s utility. Rather, they reinforce that AI functions as an expert analytical assistant—not an autonomous fiduciary. Indeed, these safeguards mirror the obligations already imposed when fiduciaries retain investment consultants, actuaries, economists, accountants, and legal advisors.
ERISA has never prohibited reliance upon expert assistance. It requires prudent supervision of that assistance. Artificial intelligence fits comfortably within that established legal framework.
Perhaps most importantly, declining to employ available analytical technologies may itself become evidence of imprudence as such technologies become standard within institutional investment practice.
The prudent expert standard is comparative. It asks what similarly situated fiduciaries exercising professional competence would reasonably do under contemporary conditions.
If sophisticated institutional fiduciaries routinely employ AI-enhanced analytics to evaluate fees, benchmark investments, conduct breakeven analyses, identify conflicts, and monitor plan investments, then refusing to utilize comparable tools without reasonable justification may itself invite judicial scrutiny.
Technology changes. The standard of prudence evolves alongside it.
The legal duty remains constant: informed, careful, loyal decision-making.Artificial intelligence advances—not diminishes—that objective.
Finally, this Court should recognize the broader policy implications. ERISA exists to protect retirement security.
Artificial intelligence enables fiduciaries to evaluate more investment options, analyze more data, identify lower-cost alternatives, improve participant outcomes, reduce administrative inefficiencies, strengthen documentation, and better defend prudent decisions when challenged.
Every dollar saved through improved fee analysis compounds for participants over decades.
Every more accurate annuity evaluation enhances retirement income security.
Every improved monitoring system reduces the likelihood that imprudent investments remain undiscovered. These are not theoretical benefits. They are measurable improvements to fiduciary governance.
The law has never demanded that fiduciaries ignore superior methods of analysisIt has demanded precisely the opposite.
Artificial intelligence is neither a substitute for fiduciary judgment nor an abdication of fiduciary responsibility. It is an instrument through which prudent fiduciaries may more faithfully discharge the duties Congress imposed under ERISA. When employed responsibly—with transparency, human oversight, documented assumptions, independent judgment, and rigorous validation—artificial intelligence strengthens every element of fiduciary process that ERISA seeks to protect.
Accordingly, the courts should recognize that the prudent use of artificial intelligence is fully consistent with ERISA’s duties of prudence and loyalty and that, in appropriate circumstances, its thoughtful implementation materially mitigates fiduciary risk while enhancing the quality, transparency, and defensibility of fiduciary decision-making.
ARGUMENT
I. ERISA’S DUTY OF PRUDENCE REQUIRES FIDUCIARIES TO EMPLOY REASONABLY AVAILABLE ANALYTICAL TOOLS THAT ENHANCE THE QUALITY OF THEIR DECISION-MAKING PROCESS.
ERISA’s fiduciary standard, as set out in Section 404(a)(1)(B), requires fiduciaries to discharge their duties
“with the care, skill, prudence, and diligence under the circumstances then prevailing that a prudent man acting in a like capacity and familiar with such matters would use….”
29 U.S.C. § 1104(a)(1)(B).
Congress deliberately chose language that evolves with professional practice. The phrase “under the circumstances then prevailing” rejects a static conception of fiduciary conduct. Prudence is measured according to contemporary standards of professional practice—not by reference to obsolete methods of analysis.
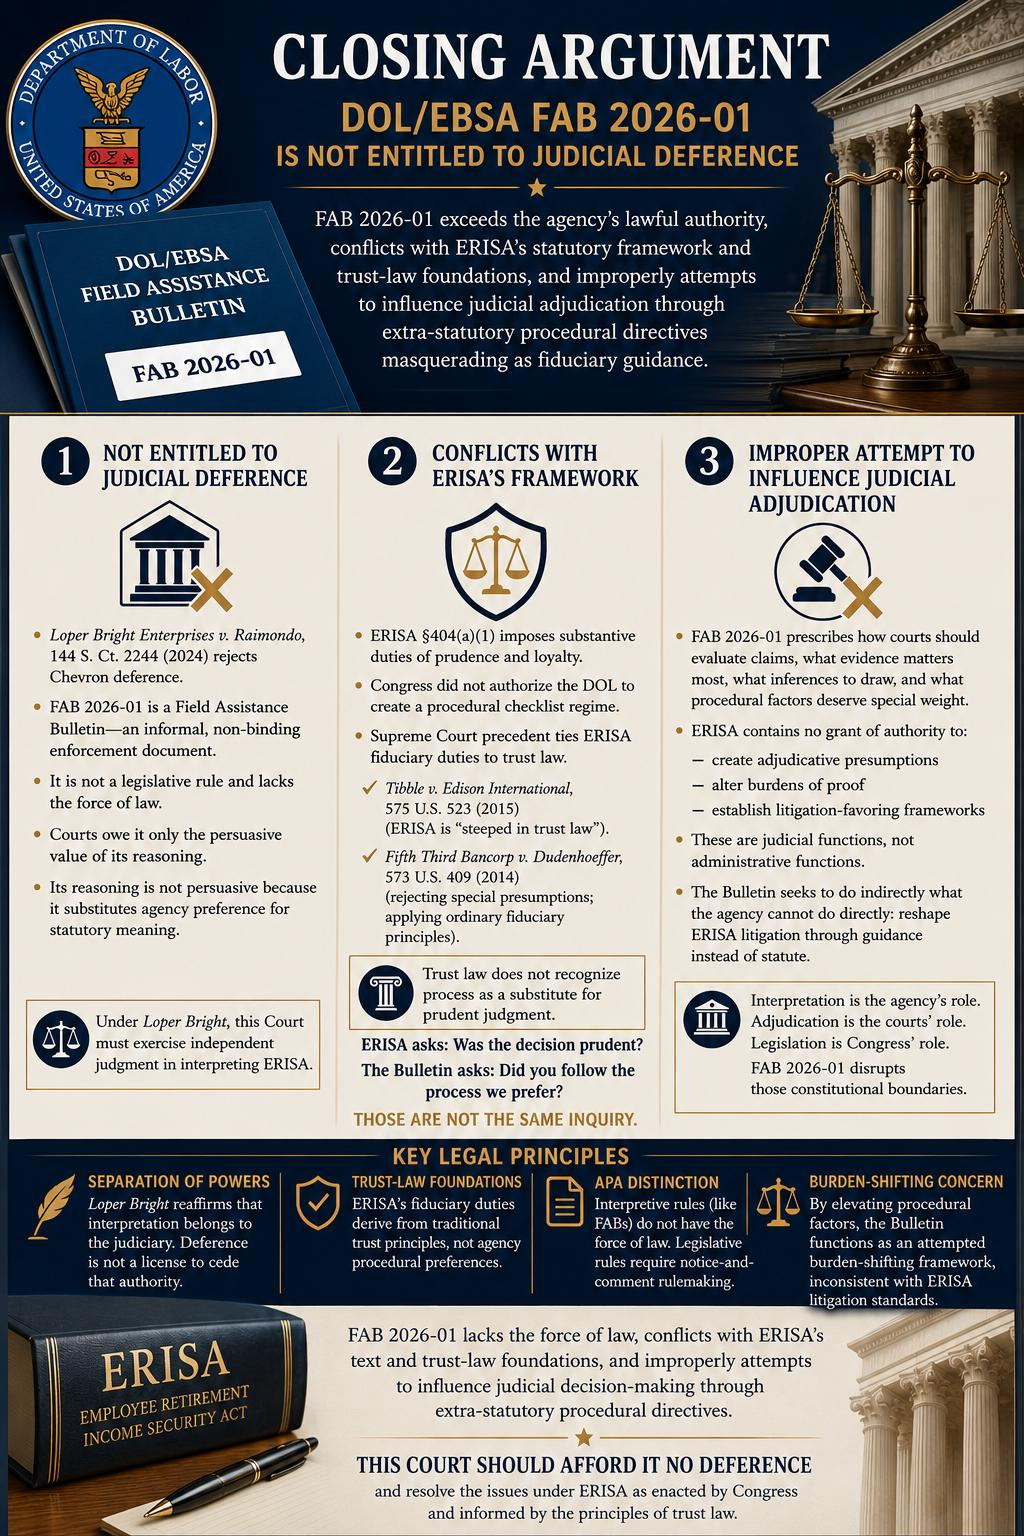
The Supreme Court has repeatedly emphasized that ERISA focuses on fiduciary process rather than investment outcomes. In Tibble v. Edison International, the Court reaffirmed that fiduciaries possess a continuing duty to monitor plan investments and remove imprudent options. That duty derives from the common law of trusts and requires an ongoing investigation into whether plan investments remain appropriate.
Likewise, in Hughes v. Northwestern University, the Court rejected the proposition that offering some prudent investment options excuses imprudent fiduciary conduct elsewhere within a retirement plan. Instead, fiduciaries must continuously engage in a reasoned evaluation of every investment alternative available to participants.
Similarly, Fifth Third Bancorp v. Dudenhoeffer reaffirmed that fiduciary prudence turns upon objective reasonableness informed by the circumstances confronting fiduciaries at the time decisions are made—not with hindsight.
These decisions collectively establish three propositions relevant here.
First, fiduciary liability ordinarily turns upon process., and the substantive prudence of sais process
Second, fiduciary process must be informed.
Third, fiduciary process must evolve alongside prevailing professional standards.
Artificial intelligence advances each of these principles. The technology neither replaces fiduciary judgment nor alters the statutory allocation of responsibility. Rather, AI functions as an analytical instrument that expands the quantity and quality of information available before fiduciaries exercise independent judgment.
Courts have never required fiduciaries to perform investment analysis using antiquated methods. To the contrary, the prudent expert standard presumes that fiduciaries will employ analytical techniques reasonably accepted within institutional investment management.
The history of fiduciary practice illustrates this principle. Fiduciaries once relied upon handwritten calculations. They later adopted computerized accounting systems, institutional portfolio analytics, Monte Carlo simulations, sophisticated actuarial software, quantitative optimization models, and electronic benchmarking platforms. No court suggested that adoption of these technologies constituted an abdication of fiduciary responsibility. Instead, each represented an improvement in the quality of fiduciary investigation.
Artificial intelligence represents the next logical progression. The governing legal principle remains unchanged. Technology informs judgment. Technology does not replace judgment. That distinction answers the principal criticism advanced by opponents of AI-assisted fiduciary decision-making.
ERISA prohibits delegation of discretionary fiduciary responsibility. It does not prohibit reliance upon sophisticated analytical assistance.
Indeed, fiduciaries routinely depend upon investment consultants, economists, actuaries, accountants, legal counsel, and recordkeepers. The common law of trusts has always recognized that prudent fiduciaries may rely upon experts possessing specialized knowledge beyond their own expertise, provided that fiduciaries independently evaluate those recommendations.
Artificial intelligence occupies precisely the same role. The fiduciary remains responsible for determining what questions should be asked.The AI system merely accelerates the process of answering them.
II. AI SUBSTANTIALLY IMPROVES COST-BENEFIT ANALYSES REQUIRED FOR PRUDENT SELECTION AND MONITORING OF MUTUAL FUNDS.
Modern excessive-fee litigation demonstrates that fiduciary disputes frequently concern whether plan committees adequately evaluated investment costs relative to expected benefits.
Meaningful cost-benefit analysis requires simultaneous evaluation of dozens of variables, including:
- expense ratios;
- institutional share class availability;
- revenue-sharing arrangements;
- securities lending income;
- transaction costs;
- benchmark-relative performance;
- tracking error;
- downside risk;
- manager tenure;
- portfolio turnover;
- asset growth;
- economies of scale;
- style consistency;
- liquidity;
- operational risks; and
- comparable alternatives available within the marketplace.
Historically, assembling these data required weeks of manual effort involving multiple consultants and numerous proprietary databases. Artificial intelligence transforms that process.
Large language models integrated with structured financial databases can organize thousands of investment characteristics into comparative matrices within minutes. Machine-learning systems can identify statistically meaningful outliers, recognize hidden correlations between fees and long-term performance, detect persistent style drift, summarize historical manager behavior, and quantify participant-level impacts associated with alternative investment selections.
Perhaps more importantly, AI permits fiduciaries to perform sensitivity analyses that previously would have been prohibitively expensive. Rather than asking whether Fund A marginally outperformed Fund B, fiduciaries can model thousands of scenarios examining the effects of varying contribution rates, market volatility, participant demographics, projected asset growth, inflation, and fee reductions over decades.
Such analyses directly advance ERISA’s objective of protecting retirement assets through informed fiduciary decision-making. The economic consequences are substantial.
Even modest reductions in annual investment expenses frequently compound into significant increases in participant retirement balances over thirty or forty years. AI enables fiduciaries to identify those opportunities with greater precision while simultaneously documenting the analytical process supporting their conclusions.
Accordingly, AI strengthens—not weakens—the fiduciary process required under § 404(a).
III. AI MATERIALly ENHANCES BREAKEVEN ANALYSES NECESSARY TO EVALUATE IN-PLAN ANNUITIES.
Lifetime income products present some of the most analytically demanding questions confronting retirement plan fiduciaries. Selecting an in-plan annuity requires simultaneous evaluation of actuarial assumptions, mortality projections, insurer solvency, participant demographics, inflation expectations, withdrawal behavior, investment opportunity costs, liquidity considerations, and longevity risk.
No single participant experiences identical circumstances. Consequently, generalized averages often obscure the true economic value of guaranteed lifetime income.
Artificial intelligence permits fiduciaries to move beyond simplistic comparisons by generating individualized breakeven analyses under thousands of possible future economic environments.
AI-driven models can calculate:
- breakeven ages under varying discount rates;
- inflation-adjusted purchasing power;
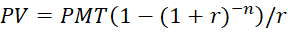
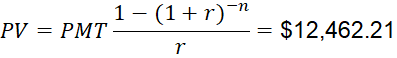
- expected present value of guaranteed income streams;
- mortality-adjusted benefit distributions;
- comparative systematic withdrawal outcomes;
- Monte Carlo simulations of market returns;
- sequence-of-returns risk;
- longevity insurance value; and
- survivor-benefit scenarios.
These analyses illuminate—not dictate—the fiduciary decision. They enable fiduciaries to understand when an annuity provides meaningful value relative to self-managed withdrawals and when alternative investment strategies may better serve participants.
By making complex actuarial comparisons more transparent, AI assists fiduciaries in satisfying ERISA’s requirement that decisions be based on a prudent investigation rather than intuition or incomplete information.
IV. PRUDENT FIDUCIARY ANALYSIS SHOULD EMPHASIZE RISK-ADJUSTED ECONOMIC VALUE RATHER THAN NOMINAL FEES OR NOMINAL RETURNS, AND ARTIFICIAL INTELLIGENCE FACILITATES THE USE OF THE ACTIVE MANAGEMENT VALUE RATIO.
One of the recurring deficiencies in excessive-fee litigation is the tendency to evaluate investment alternatives through simplistic comparisons of expense ratios or nominal historical returns. Such comparisons are analytically incomplete because they fail to account for the economic value, if any, generated by active management after adjusting for the risks assumed in producing those returns. ERISA requires considerably more.
The statutory duty of prudence demands that fiduciaries evaluate investments based upon all material economic considerations reasonably available at the time of the decision. Neither the text of ERISA nor the common law of trusts suggests that fiduciaries satisfy this obligation by selecting the least expensive investment available or by identifying the investment exhibiting the highest historical return. Rather, fiduciaries must determine whether participants receive sufficient value to justify the costs incurred. That inquiry necessarily requires measuring incremental value, not merely incremental cost.
A. Nominal Fee Comparisons Are Economically Incomplete.
An actively managed mutual fund charging a higher expense ratio than an index fund is not imprudent merely because it costs more. Conversely, a low-cost fund is not necessarily prudent simply because its expense ratio is lower. The relevant question is whether the additional fees purchase sufficient incremental economic value after accounting for risk.
Traditional comparisons often examine only:
- expense ratio;
- one-, three-, five-, or ten-year returns;
- benchmark performance; and
- percentile rankings.
Those measures, standing alone, provide an incomplete assessment of participant value because they ignore differences in systematic risk, factor exposures, downside volatility, correlation with existing plan investments, diversification benefits, and persistence of manager skill.
Two funds producing identical nominal returns may contribute dramatically different economic value to a diversified retirement portfolio. Likewise, two funds charging identical fees may generate materially different levels of participant welfare depending upon their marginal contribution to overall portfolio efficiency. Accordingly, prudent fiduciary analysis should focus upon risk-adjusted incremental value, rather than isolated comparisons of cost or return.
B. The Active Management Value Ratio Provides a More Complete Measure of Fiduciary Value.
The proposed Active Management Value Ratio (“AMVR”) metric provides precisely this analytical framework.
Rather than asking whether active management is simply “worth the fee,” the AMVR evaluates whether the incremental risk-adjusted return attributable to active management exceeds its incremental cost after accounting for the fund’s correlation with available alternatives and its contribution to total portfolio efficiency.
Conceptually, the metric may be expressed as:
Active Management Value Ratio = Risk-Adjusted Incremental Economic Benefit ÷ Incremental Active Management Cost
The numerator reflects value added after adjusting for systematic and idiosyncratic risks, correlation effects, diversification benefits, and other relevant portfolio characteristics.
The denominator represents the additional costs incurred by selecting active management instead of the most appropriate passive or lower-cost alternative.Unlike conventional fee comparisons, the AMVR recognizes that active management may create value through multiple channels, including:
- positive risk-adjusted alpha;
- lower downside capture during market declines;
- reduced portfolio volatility through imperfect correlation;
- enhanced diversification;
- superior tax efficiency where applicable;
- improved liquidity management;
- factor diversification; and
- dynamic risk management not reflected in nominal return statistics.
Conversely, the AMVR appropriately identifies situations in which higher fees purchase little or no incremental economic benefit despite attractive nominal returns. The resulting analysis better aligns fiduciary evaluation with modern principles of portfolio theory.
C. Artificial Intelligence Makes Sophisticated AMVR Analysis Practical for Fiduciary Committees.
Historically, analyses incorporating correlation matrices, multi-factor risk models, downside-risk measures, Monte Carlo simulations, tracking-error decomposition, and incremental portfolio optimization required specialized quantitative expertise beyond the resources of many retirement plan committees. Artificial intelligence substantially changes that reality.
Modern AI systems can rapidly integrate data from portfolio analytics, benchmark databases, factor models, historical return series, and plan-specific investment menus to calculate the AMVR across numerous investment alternatives.
AI-assisted analysis enables fiduciaries to:
- estimate incremental risk-adjusted alpha;
- calculate marginal contributions to portfolio variance;
- evaluate changing correlation structures during stressed markets;
- estimate diversification benefits across existing plan investment menus;
- compare active and passive alternatives under multiple economic scenarios;
- perform sensitivity analyses using varying assumptions regarding fees, volatility, inflation, and participant behavior; and
- document every analytical assumption supporting the committee’s conclusions.
What once required weeks of quantitative modeling can now be completed within minutes while producing a transparent record suitable for fiduciary review and judicial examination.Importantly, AI does not determine whether a fund should remain in the plan. Rather, AI supplies a more complete economic analysis from which fiduciaries exercise independent judgment.
D. AMVR Better Reflects ERISA’s Process-Oriented Standard of Prudence.
ERISA requires a prudent investigation—not predetermined investment outcomes. The AMVR strengthens fiduciary process because it requires committees to evaluate both sides of the economic equation:
- What additional costs are participants paying?
- What measurable incremental benefits are participants receiving?
- Are those benefits sufficient after adjusting for the risks undertaken to obtain them?
- Does the investment improve the efficiency of the participant’s overall retirement portfolio rather than merely outperforming a benchmark in isolation?
These are precisely the types of questions that prudent experts increasingly ask when evaluating institutional investment strategies. By encouraging fiduciaries to assess incremental costs against incremental, correlation-adjusted, risk-adjusted benefits, the AMVR advances ERISA’s twin objectives of protecting retirement assets and promoting informed fiduciary decision-making.
E. Courts Should Encourage Analytical Frameworks That Improve the Quality of Fiduciary Process.
Nothing in ERISA prescribes a particular quantitative methodology for evaluating mutual funds. That flexibility is deliberate. It permits fiduciaries to adopt more sophisticated analytical techniques as finance evolves.
The AMVR exemplifies such an evolution. Rather than replacing established fiduciary principles, it operationalizes them. It transforms the abstract obligation to conduct a prudent investigation into a disciplined, transparent, economically rigorous methodology capable of objective review.
Artificial intelligence makes widespread implementation of this methodology feasible by substantially reducing the cost, time, and technical complexity historically associated with advanced portfolio analytics.
As AI continues to democratize institutional-quality financial analysis, fiduciaries can no longer be expected to rely exclusively upon nominal expense ratios and historical returns when materially superior analytical methods are readily available. The prudent expert standard is not satisfied by comparing prices alone. It requires evaluating value. The Active Management Value Ratio provides a coherent framework for doing precisely that, and AI provides the practical means by which fiduciaries can employ that framework consistently, transparently, and at reasonable cost.
Accordingly, fiduciaries who incorporate AI-assisted AMVR analyses into their investment review process materially strengthen both the substance and the evidentiary record of their fiduciary deliberations, thereby reducing litigation risk while improving participant outcomes.
V. THE ACTIVE MANAGEMENT VALUE RATIO DERIVES ITS FIDUCIARY UTILITY FROM COMBINING THE MODIGLIANI MEASURE OF RISK-ADJUSTED RETURN WITH MILLER’S ACTIVE EXPENSE RATIO TO PRODUCE A COMPREHENSIVE ECONOMIC ASSESSMENT OF INCREMENTAL VALUE.
The ultimate objective of fiduciary analysis is not to identify the highest-performing investment in isolation. It is to determine whether an investment contributes sufficient economic value to justify its incremental costs within the context of a diversified retirement portfolio. The Active Management Value Ratio (“AMVR”) advances that objective by integrating two complementary analytical components.
First, it measures the incremental economic benefit produced by active management through a risk-adjusted return metric that reflects the investment’s contribution after accounting for the risks undertaken. Second, it measures the true incremental cost of obtaining that benefit by adjusting expenses to reflect the extent to which active management actually differs from lower-cost alternatives.
Together, these measurements transform the fiduciary inquiry from one focused on isolated performance into one centered on participant value.
A. The Modigliani Measure Provides an Economically Intuitive Measure of Incremental Risk-Adjusted Return.
Traditional performance measures frequently present fiduciaries with statistics that are difficult to interpret in economic terms. Measures such as the Sharpe Ratio, Information Ratio, and alpha are valuable analytical tools, but they often express performance in units that lack direct economic meaning for committee members who must ultimately exercise fiduciary judgment.
The Modigliani risk-adjusted performance measure (commonly referred to as the M² Measure) addresses this limitation. Rather than expressing performance as an abstract ratio, the Modigliani Measure converts risk-adjusted performance into return units directly comparable to benchmark returns. By expressing performance as an equivalent return after normalizing portfolio risk, the measure allows fiduciaries to evaluate the economic value generated by active management in terms readily understood by investment committees and reviewing courts alike.
Within the AMVR framework, the Modigliani Measure serves as the numerator because it estimates the incremental return attributable to active management after controlling for differences in portfolio risk. This approach recognizes that fiduciaries should reward managers only for generating genuine economic value—not merely for assuming greater volatility.
Consequently, two actively managed funds producing identical nominal returns may exhibit materially different incremental value once differences in systematic and total portfolio risk are properly incorporated.
Using the Modigliani Measure therefore aligns fiduciary analysis with ERISA’s requirement that investment decisions be based upon careful consideration of all relevant economic factors rather than superficial performance rankings.
B. Miller’s Active Expense Ratio Better Measures the True Incremental Cost of Active Management.
The denominator of the AMVR likewise requires refinement.
Expense ratios alone frequently overstate the economic cost of active management because they assume that every basis point of additional expense represents active investment decision-making. That assumption is rarely correct.
Many actively managed funds maintain substantial overlap with passive benchmarks while charging materially higher fees. Conversely, genuinely differentiated active strategies may justify a greater proportion of their expenses because they provide investment characteristics unavailable through passive alternatives.
Miller’s Active Expense Ratio (“AER”) addresses this distinction by adjusting the apparent incremental cost of active management to reflect the degree of active differentiation and correlation between the active portfolio and its relevant alternatives. Rather than measuring cost in isolation, the AER estimates the effective price participants pay for economically meaningful active management.
As correlation between an actively managed portfolio and its passive benchmark approaches unity, the incremental value of paying active management fees generally diminishes, and the effective active expense correspondingly increases. Conversely, where an active strategy provides genuinely differentiated exposures that improve portfolio efficiency, diversification, or downside protection, the adjusted active expense more accurately reflects the true economic cost of obtaining those benefits.
The result is a denominator that better captures what participants actually purchase when paying for active management.
C. The Combination of the Modigliani Measure and Active Expense Ratio Produces a Fiduciary Decision Metric Rather Than a Mere Performance Statistic.
Standing alone, neither performance metrics nor fee metrics fully answer the fiduciary question presented by ERISA.
Performance measures evaluate returns. Fee measures evaluate costs. Neither independently evaluates value.
The AMVR bridges this analytical gap by combining:
- incremental risk-adjusted economic benefit, measured through the Modigliani Measure; and
- incremental correlation-adjusted economic cost, measured through Miller’s Active Expense Ratio.
The resulting ratio expresses a concept directly relevant to fiduciary decision-making:
How much incremental, risk-adjusted participant value is produced for every incremental unit of economically meaningful active-management cost?
That inquiry corresponds closely to the economic substance of ERISA’s prudence requirement.
Prudent fiduciaries are not obligated to minimize expenses irrespective of value. Nor are they obligated to maximize returns irrespective of risk.
Rather, they must evaluate whether participant resources are expended in a manner reasonably calculated to improve retirement outcomes. The AMVR directly measures that relationship.
D. Artificial Intelligence Enables Routine Calculation of Metrics That Historically Were Impractical.
Although the Modigliani Measure and the Active Expense Ratio each rely upon well-established principles of financial economics, integrating both into routine fiduciary analysis historically required significant computational effort. Artificial intelligence largely eliminates those practical barriers.
Modern analytical systems can automatically calculate risk-adjusted returns, estimate correlation matrices, perform factor decompositions, normalize volatility, estimate effective active costs, conduct scenario analyses, and update these calculations continuously as market conditions evolve.
AI also enhances transparency by documenting every input, assumption, calculation, and sensitivity analysis underlying the resulting AMVR. This documentation materially strengthens the fiduciary record.
Rather than merely demonstrating that investment committees reviewed historical returns and expense ratios, fiduciaries can establish that they evaluated the complete economic relationship among incremental return, incremental risk, incremental cost, and portfolio diversification.
Such documentation is especially valuable in litigation, where courts consistently examine the quality and rigor of fiduciary process.
E. Because the AMVR Measures Fiduciary Value Rather Than Investment Performance Alone, It Better Serves ERISA’s Objectives.
Perhaps the most significant contribution of the AMVR is conceptual rather than computational. Its purpose is not to identify “winning” mutual funds.
Its purpose is to assist fiduciaries in determining whether participants receive sufficient incremental economic value to justify the incremental resources devoted to active management. That distinction is fundamental.
Investment managers compete on performance. Fiduciaries must evaluate value.
Performance statistics answer the former question. The AMVR answers the latter.
Accordingly, by integrating the Modigliani Measure’s economically intuitive assessment of incremental risk-adjusted return with Miller’s Active Expense Ratio’s economically realistic assessment of incremental active-management cost, the AMVR becomes a fiduciary decision metric uniquely aligned with ERISA’s emphasis on informed, reasoned, and economically rational decision-making.
As artificial intelligence makes these calculations both practical and transparent, fiduciaries possess an unprecedented opportunity to replace simplistic comparisons of nominal fees and historical returns with a disciplined methodology that better reflects the economic interests of retirement plan participants and beneficiaries. Courts evaluating fiduciary prudence should therefore regard the use of such integrated analytical frameworks as evidence of a robust and well-informed decision-making process, rather than as mere reliance on sophisticated performance statistics.
Notes
1. 29 U.S.C.A. Section 1104(a)B)(1)(B).
2 .Ibid.
3. Tibble v. Edison, 575 U.S. 523 (2015)..
4. Hughes v. Northwestern University, 595 U.s. 170 (2022.)..
5. Fifth Third Bancorp v. Dudenhoeffer, 573 573 U.S. 409 (2014).


You must be logged in to post a comment.