
James W. Watkins, III, J.D., CFP EmeritusTM, AWMA®
InvestSense, LLC
I. Executive Summary
Several years ago, I created a simple metric, the Active Management Value Ratio™ (AMVR). Since studies have shown that people are more visually oriented than verbally oriented, the AMVR is a visual representation of the research and concepts of investment icons such as Nobel laureate Dr. William F. Sharpe, Charles D. Ellis, and Burton G. Malkiel. The AMVR also incorporates the research of professor Ross Miller of the State University of New York, creator of the Active Expense Ratio.
The best way to measure a manager’s performance is to compare his or her return with that of a comparable passive investment.1
So, the incremental fees for an actively managed fund relative to its incremental returns shoud always be compared to the fees for a comparable index fund relative to its returns. When you do this, you’ll quickly see that the incremental fees for active management are really, really high – on average, over 100 of incremental returns.2
Past performance is not helpful in predicting future returns. The two variables that do the best job in pedicting future performance [of mutual funds] are expense ratios and turnover.3
Under fiduciary standards of prudence, investment decisions must reflect a reasoned evaluation of costs relative to expected benefits, assessed in the context of risk, diversification, and portfolio objectives.
The Active Management Value Ratio (AMVR) is best understood as a structured cost-benefit test:
Benefit = Incremental risk-adjusted return attributable to active management
Cost = Incremental correlated-adjusted costs required to obtain that return
Decision Metric = Whether correlation-adjusted incremental cost exceeds incremental risk-adjusted return.
Unlike simplistic comparisons of nominal return and expense ratios, AMVR incorporates:
Incremental return (above a passive alternative)
Risk-adjusted return (e.g., alpha)
Cost net of correlated portfolio effects
AMVR aligns directly with fiduciary duty principles emphasizing prudence, reasonableness, and process discipline
II. Fiduciary Framework
Under longstanding fiduciary principles (including those applied under ERISA jurisprudence and trust law), prudence requires:
- A reasoned decision-making process
- Evaluation of alternatives
- Cost awareness
- Risk consideration
- Diversification and portfolio context
Critically, fiduciary law does not require selection of the lowest-cost option. It requires selection of options whose costs are justified by expected benefits, evaluated in context.
Thus, a proper fiduciary analysis must address:
Do the incremental expected benefits of active management justify its incremental costs, after accounting for risk?
AMVR addresses this question and provides a legally effective and jusifiable process.
III. AMVR as a Structured Cost-Benefit Analysis
The AMVR can be expressed conceptually as:
AMVR=Incremental Correlation-Adjusted Cost divided by Incremental Risk- Adjusted Return. The goal is an AMVR equalto or less then 1.00.
Where:
- Incremental Return = Active return above passive alternative.
- Risk Adjustment = Adjustment for volatility, tracking error, drawdown risk, or factor exposure.
- Correlation-Adjusted Cost = Recognition that costs and returns are not independent,
This mirrors traditional cost-benefit analysis used in economics and capital budgeting.
B. Why Nominal Return Comparisons Are Inadequate
A nominal comparison:
- Active return: 8%
- Passive return: 7%
- Active fee: 0.80%
- Passive fee: 0.05%
The foregoing data superficially suggests:
“Active outperformed by 1% and costs 0.75% more.”
But this scenario ignores:
- Volatility differences
- Downside capture
- Tracking error
- Diversification effects within the total portfolio
- Correlation between cost drag and return variability
Nominal comparisons treat return and cost as static and independent. In reality, they are probabilistic and correlated.
IV. Incremental Risk-Adjusted Return: The Proper Benefit Measure
A. Incremental, Not Absolute
The relevant question is not:
Did the manager produce a high return?
But rather:
Did the manager produce incremental return relative to a comparable passive alternative?
Active strategies often introduce:
- Higher volatility
- Concentration risk
- Factor tilts
- Tracking error
- Tail risk
Therefore, benefit must be measured as:
- Alpha net of systematic exposures
- Risk-adjusted metrics
- Downside-adjusted performance
Risk-adjusted metrics better reflect:
- Expected utility to beneficiaries
- Probability distribution of outcomes
- Portfolio-level contribution
A fiduciary cannot prudently evaluate benefits without adjusting for risk.
V. Correlation-Adjusted Costs: The Proper Cost Measure
A. Costs Are Not Independent of Returns
Active management costs include:
- Explicit fees, e.g., expense ratios
- Trading costs
- Tax impact
- Cash drag
- Market impact
But more importantly:
- These costs interact with volatility and turnover
- Higher risk strategies often incur higher implementation costs
Thus, cost is probabilistic and performance-linked.
B. Incremental Cost Must Be Measured Relative to Viable Passive Alternatives
The proper cost comparison requires the use of a fund’s Incremental Correlation-Adjusted Cost (ICAC)
ICAC=Active Total Cost−Passive Total Cost
Including:
- Expense ratio differential
- Turnover-related transaction costs
- Implementation shortfall
This produces a more accurate assessment of the economic burden (costs) imposed on beneficiaries.
VI. Portfolio Context: Fiduciary Relevance
An active manager may:
- Improve diversification
- Reduce drawdown risk
- Provide crisis alpha
- Offset other factor exposures
AMVR, by incorporating risk-adjusted incremental return, implicitly captures:
- Portfolio-level covariance effects
- Diversification benefits
- Marginal contribution to risk
Nominal comparisons do not/cannot capture these effects.
VII. Alignment With Fiduciary Standards
The AMVR framework aligns with fiduciary prudence because it:
1. Is Comparative
Evaluates active performance against a reasonable passive alternative.
2. Is Risk-Aware
Adjusts expected benefit for volatility and downside risk.
3. Is Cost-Conscious
Incorporates incremental and correlated costs.
4. Is Portfolio-Oriented
Reflects contribution to total portfolio risk and return.
5. Is Process-Driven
Provides a replicable, documented analytical method.
AMVR formalizes an objective, defensible decision-making process.
VIII. Why AMVR Is More Meaningful Than Nominal Return/Fee Comparisons
Nominal Comparison | AMVR Framework |
| Looks at raw return | Looks at incremental return |
| Ignores volatility | Adjusts for risk |
| Compares fee ratios only | Compares total incremental cost |
| Ignores portfolio impact | Evaluates marginal portfolio contribution |
| Static and backward-looking | Probabilistic and forward-looking |
Nominal comparisons answer:
“Was the return higher than the fee?”
AMVR answers:
“Did beneficiaries receive adequate risk-adjusted incremental benefit for the incremental economic burden imposed?”
Only the latter reflects fiduciary reasoning.
IX. Legal Defensibility
In litigation or regulatory reviews, fiduciaries must demonstrate:
- Consideration of viable alternatives
- Analysis of cost relative to benefit
- Awareness of risk characteristics
- A reasoned, documented process
A documented AMVR analysis demonstrates:
- Objective evaluation
- Benchmark-relative reasoning
- Risk consideration
- Economic rationality
This materially strengthens procedural prudence defensibility.
X. Conclusion
The Active Management Value Ratio is not an exotic performance statistic. It is a structured, fiduciary-relevant cost-benefit analysis using incremental risk-adjusted returns and correlated incremental costs.
Its utility of the AMVR lies in:
- Measuring benefit properly (risk-adjusted, incremental)
- Measuring cost properly (incremental, correlated, total)
- Evaluating both within portfolio context
By contrast, simple nominal return and fee comparisons are incomplete and potentially misleading because they ignore risk, correlation, and portfolio effects.
For fiduciaries charged with acting solely in the interest of beneficiaries, AMVR provides a more economically coherent, legally defensible, and analytically rigorous framework for evaluating active management.
Section Three
Integrating AI to Level the Playing Field
Undeer ERISA 404(a), a plan sponsor has a fiduciary duty to independently investigate, and select each invesment option offered within an ERISA plan. Properly designed and implemented, AI can make those processes much easier for a plan sponsor and other investment fiduciaries. AI can provide evidence of a prudent process and a proactive and effective fiduciary risk management program.
Professor Ross Miller, creator of the Active Expense Ratio metric, explains the importance of the metric in investing, especially fiduciary investing, as follows:
Mutual funds appear to provide investment services for relatively low fees because they bundle passive and active funds together in a way that understates the true cost of active management. In particular, funds engaging in ‘closet’ or ‘shadow’ indexing, charge their investors for active maangement while providing them with little more than an indexed investment. Even the average mutual fund, which ostensibly provides only active management, will have 90% of the variance in its returns explained by its benchmark index.4
The quality of any AI query depends on the quality of the prompts used to define the query. The following is the sample query that we recommend to our fiduciary risk management clients in using the Active Management Value Ratio:
Prepare a fiduciary prudence cost benefit analysis comparing FCNKX and FXIAX, for the most recent five year period ending December 31, 2025,with incremental risk-adjusted returns calculated using the Modigliani measure, and incremental correlation-adjusted costs,calculated using Miller’s Active Expense Ratio, using an r-squared score of 97, with results presented in tabular form.
Unfortunately, AI is susceptible to the same “garbage in, garbage out” issues as computer asset allocation programs. While my AI expereince has been very positive in terms of accuracy, I have noticed more AI mistakes in misquoting nominal fund expenses ratios than any other area. Investment fiduciaries can verify data used in calculating correaltion-adjusted cost by visiting the Portfolio Visualization site (portrfoliovisualization.com) or by submitting a simple AI query itself in order to ensure accuracy of the data
Using the AI prompt shown above resulted in the following data and analysis:
Methodology Recap
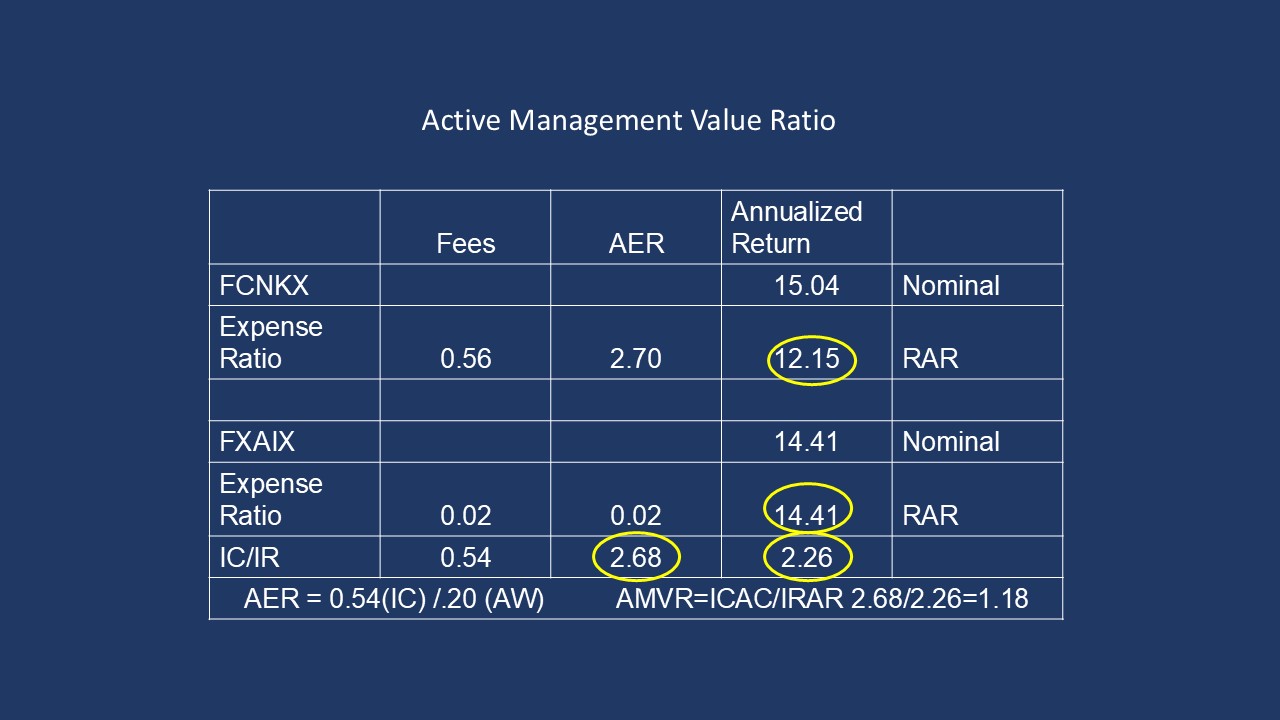
Active Expense Ratio (AER) – Allocates the excess cost paid for active management to only the portion of returns that can be considered truly active (i.e., not explained by the benchmark). The formula is:
AER=Incremental Cost divided by Miller’s Active Weight metric
Where:
- Incremental Cost = Correlation-adjusted active fund expense – Index fund expense
- Active Weight (AW) ≈ 1 – √(R‑squared), per Miller’s proxy for the non‑explained return portion relative to the benchmark
This mirrors the logic that a high r‑squared implies most return variation is explained by the benchmark, leaving a small active portion that investors are paying for.(fiduciaryinvestsense.com) The resulting AMVR chart appears below
Key Inputs
| Parameter | FCNKX | FXAIX |
| Expense Ratio | ~0.56% ‑ ~0.74%¹ | ~0.02%‑0.03%² |
| Benchmark | S&P 500 | S&P 500 |
| R‑Squared vs FXAIX | 0.94 (given) | n/a |
| Incremental Cost | 0.54% (given) | n/a |
Multiple data sources on FCNKX list the fund’s expense ratio in the ~0.56%‑0.74% range. FXAIX’s expense ratio is widely reported at ~0.015%‑0.03%. Here the expense ratios used were 56 basis points (0.56) for FCNKX and 3 basis points (0.03) for FXAIX.
Active Weight (AW) (proxy):
\AW=1 – \sqrt of r-squared{0.94} ≈ 1 – 0.97 ≈ 0.03 (or ~3.0% active)}
Analysis Results (Five‑Year Ending Dec 31 2025)
| Metric | Calculation | Result |
| Active Weight (AW) | 1 − √(0.94) | ~3.0 % |
| Incremental Cost | FCNKX ER − FXAIX ER | 0.54 % |
| Miller Active Expense Ratio | 0.54 % ÷ 0.03 | ~18.0 % |
Comparative Table
| Fund | Published ER (Annual) | Incremental Cost vs FXAIX | Active Weight | Miller AER (Implicit Active Cost) |
| FCNKX | ~0.56%‑0.74% | 0.54% | ~3.0% | ~18.0 % |
| FXAIX | ~0.02%‑0.03% | n/a | n/a | — |
Interpretation
Active Weight of ~3 % implies that, based on the r‑squared of 0.94, approximately 97 % of FCNKX’s returns over this period move in line with the S&P 500 benchmark. The remaining ~3 % constitutes the active component of returns that might reflect stock‑selection or timing decisions.
Incremental Cost of 0.54 % reflects FCNKX’s excess fee over FXAIX, which represents the implicit price investors pay for active management.
When this incremental cost is allocated to only the active component via Miller’s AER measure:
FCNKX’s AER ≈ ~18 %
This means that investors are effectively paying approximately 18 % per year (or ~1,800 bps) for each unit of active contribution in FCNKX over this five‑year period.
This highlights a substantially higher effective cost of active management than the published headline fee — a central insight in fiduciary cost‑benefit debates about “closet indexing” and active fee justification.
Fiduciary Perspective
Cost Efficiency: FXAIX’s extremely low published expense ratio (≈0.02 %‑0.03 %) makes it a cost‑efficient proxy for S&P 500 exposure.
Active Contribution: FCNKX’s high r‑squared implies a small active component, so the true cost per unit of active exposure is very high, per the AER metric.
Implication: Fiduciaries evaluating fund costs relative to value added may find it difficult to justify the active fee premium of FCNKX given its modest active weight, especially when a low‑cost index alternative like FXAIX provides broad market exposure with far lower implicit costs.
A properly conducted fiduciary cost-benefit prudence analysis can alert a plan sponsor and other investment fiduciaries, e.g., trustees, to potential “red flags” of potential fiduciary liability traps, e.g., a high r-squared score combined with an actively managed fund’s high incremental cost numbers. Properly utilized, AI can significantly and effectively minimize a plan sponsor’s potential fiduciary risk liability exposure.
Since an AMVR > 1.00 indicates that a fund’s incremental costs exceed it incremental return, the sample AMVR here indicates that FCNKX is an imprudent investment choice relative to FXAIX. A simple cost-benefit analysis can be very informative, especially one such as the AMVR, which raises the bar to conform to the higher standards demanded under fiduciary law.
Summary – Risk‑Adjusted Perspective
- Published Expense Ratios > 0.56 -0.74 (FCNKX), ).02-0.03 (FXAIX)
- Investment Cost > 0.54 (FCNKX) (used for AER)
- R-squared > 0.94 (high correlation implies small active component)
- Active Weight > 3.0% (proxy for actual active contribution)
- Miller AER > 18.0% (cost of active risk relative to explained return)
1. FXAIX Exhibits Superior Risk‑Adjusted Returns:
Across multiple, widely used ratios (here, the Modigliani measure was used), FXAIX delivered better risk‑adjusted performance than FCNKX over the trailing five years, indicating that for each unit of risk taken, the index fund tended to generate more return.
2. FCNKX Carries Higher Volatility:
FCNKX shows higher standard deviation and larger historical drawdowns, meaning more pronounced swings in investor outcomes during adverse markets.
3. High Implied Active Cost with Lower Adjusted Returns:
When combined with the Miller AER result (~18.0%), FCNKX appears to charge significantly more for active management, without commensurate risk‑adjusted benefits relative to FXAIX. This is relevant for fiduciary reviews emphasizing both cost and outcome efficiency.
The AMVR provides a structural process, one that is sound and legally defensible. The utility of the AMVR is that the metric transforms the active-passive debate into a familiar economic exercise: cost-benefit analysis, one that results in the correct analytical question for investment fiduciaries NOT being based solely on the level of fees, but rather:
Does active management provide a sufficient incremental risk-adjusted benefit to justify its incremental correlation-adjusted cost?
Fortunately, artificial intelligence helps makes it easier to answer that question and analyze viable alternative fiduciary prudence scenarios in order to effectively minimize unnecessary and unwanted fiduciary liability exposure.
The resulting AMVR fiduciary prudence analysis clearly established the imprudence of FCNKX relative to FXAIX for the time period studied.
Notes
1. William F. Sharpe, “The Arithmetic of Active Investing,” available online t https://web.stanford.edu/~wfsharpe/art/active/active.htm.
2. Charles D. Ellis, “Letter to the Grandkids: 2 Essential Investing Guidelines” https://www.forbes.com/sites/investor/2014/03/13/letter-to-the-grandkids-12-essential-investing-guidelines/#cd420613736c.
3. Burton G. Malkiel, “A Random Walk Down Wall Street,” 11th Ed., (W.W. Norton & Co., 2016), 460.
4. Ross Miller, “Evaluating the True Cost of Active Management by Mutual Funds,” Journal of Investment Management, Vol. 5, No. 1, 29-49 (2007). https://papers.ssrn.com/sol3/papers.cfm?abstract_id=746926.
© Copyright 2026 InvestSense, LLC. All rights reserved.
This article is for informational purposes only and is neither designed nor intended to provide legal, investment, or other professional advice since such advice always requires consideration of individual circumstances. If legal, investment, or other professional assistance is needed, the services of an attorney or other qulified professional advisor should be sought.
Posted in fiduciary compliance | Tagged 401k, compliance, ERISA, fiduciary investing, fiduciary law, fiduciary liability, Fiduciary litigation, fiduciary responsibility, fiduciary risk management, plansponsors, risk management | Leave a


You must be logged in to post a comment.